###Embeddable###
###Embeddable###
###Embeddable###
###Embeddable###
###Embeddable###
###Embeddable###
###Embeddable###
###Embeddable###
###Embeddable###
###Embeddable###
###Embeddable###
###Embeddable###
###Embeddable###
###Embeddable###
###Embeddable###
###Embeddable###
###Embeddable###
###Embeddable###
###Embeddable###
###Embeddable###
###Embeddable###
###Embeddable###
###Embeddable###
###Embeddable###
###Embeddable###
###Embeddable###
###Embeddable###
###Embeddable###
###Embeddable###
###Embeddable###
###Embeddable###
###Embeddable###
###Embeddable###
###Embeddable###
###Embeddable###
###Embeddable###
Taxes > Taxes Too High Too Low Graph % Too high % About right 2026 Mar 59 37 2025 Mar 59 38 2024 Apr 56 36 2023 Apr 60 36 2022 Apr 54 41 2021 Apr 50 44 2020 Apr 46 48 2019 Apr 45 48 2018 Apr 45 48 2017 Apr 51 42 2016 Apr 57 37 2015 Apr 51 42 2014 Apr 52 42 2013 Apr 50 45 2012 Apr 46 47 2011 Apr 50 43 2010 Apr 48 45 2009 Apr 46 48 2008 Apr 52 42 2007 Apr 53 41 2006 Apr 48 44 2005 Apr 51 44 2004 Apr 50 43 2003 Apr 50 46 2003 Jan 47 50 2001 Apr 65 31 2000 Apr 63 33 1999 Sep 68 28 1999 Jul 60 37 1999 Apr 65 29 1998 Apr 66 31 1997 Mar 58 38 1996 Apr 64 33 1994 Dec 66 30 1994 Apr 56 42 1993 Mar 55 41 1992 Mar 56 39 1991 Mar 55 37 1990 Mar 63 31 1985 Jun 63 32 1982 May 60 32 1973 Feb 65 28 1969 Mar 69 25 1967 Mar 58 38 1966 Feb 52 39 1964 Feb 56 35 1963 Jan 52 38 1962 Jun 63 32 1962 Feb 48 45 1961 Feb 46 45 1959 Mar 51 40 1957 Apr 61 31 1956 Feb 55 35
Taxes > Too High Low Table Too high About right Too low No opinion % % % % 2026 Mar 2-18 59 37 3 1 2025 Mar 3-16 59 38 2 1 2024 Apr 1-22 56 36 4 4 2023 Apr 3-25 60 36 3 2 2022 Apr 1-19 54 41 3 2 2021 Apr 1-21 50 44 4 2 2020 Apr 1-14 46 48 3 2 2019 Apr 1-9 45 48 4 4 2018 Apr 2-11 45 48 3 3 2017 Apr 5-9 51 42 4 4 2016 Apr 6-10 57 37 3 3 2015 Apr 9-12 51 42 3 4 2014 Apr 3-6 52 42 3 4 2013 Apr 4-7 50 45 2 3 2012 Apr 9-12 46 47 3 4 2011 Apr 7-11 50 43 4 3 2010 Apr 8-11 48 45 3 4 2009 Apr 6-9 46 48 3 2 2008 Apr 6-9 52 42 2 4 2007 Apr 2-5 53 41 2 3 2006 Apr 10-13 48 44 2 5 2005 Apr 4-7 51 44 2 3 2004 Apr 5-8 50 43 3 4 2003 Apr 7-9 50 46 2 2 2003 Jan 10-12 ^ 47 50 1 2 2001 Apr 6-8 65 31 1 3 2000 Apr 7-9 63 33 1 3 1999 Sep 10-14 68 28 1 3 1999 Jul 16-18 60 37 * 3 1999 Apr 6-7 65 29 2 4 1998 Apr 17-19 66 31 1 2 1997 Mar 24-26 58 38 1 3 1996 Apr 9-10 64 33 1 2 1994 Dec 16-18 66 30 1 3 1994 Apr 16-18 56 42 * 2 1993 Mar 29-31 55 41 2 2 1992 Mar 26-29 56 39 2 3 1991 Mar 28-30 55 37 2 6 1990 Mar 8-11 63 31 2 4 1985 Jun 7-10 63 32 1 4 1982 May 14-17 60 32 * 8 1973 Feb 16-19 65 28 1 6 1969 Mar 12-17 69 25 * 6 1967 Mar 9-14 58 38 1 3 1966 Feb 10-15 52 39 * 8 1964 Feb 28-Mar 5 56 35 1 9 1963 Jan 11-16 52 38 1 8 1962 Jun 28-Jul 3 63 32 1 4 1962 Feb 8-13 48 45 * 7 1961 Feb 10-15 46 45 1 8 1959 Mar 4-9 51 40 2 7 1957 Apr 6-11 61 31 * 8 1956 Feb 16-21 55 35 1 9
Taxes > Income Tax Fair Table Yes, fair No, not fair No opinion % % % 2026 Mar 2-18 47 49 4 2025 Mar 3-16 46 50 3 2024 Apr 1-22 49 47 5 2023 Apr 3-25 46 51 3 2022 Apr 1-19 54 44 2 2021 Apr 1-21 55 43 2 2020 Apr 1-14 59 39 2 2019 Apr 1-9 57 39 3 2018 Apr 2-11 61 36 3 2017 Apr 5-9 61 35 4 2016 Apr 6-10 50 47 3 2015 Apr 9-12 56 40 4 2014 Apr 3-6 54 41 5 2013 Apr 4-7 55 42 3 2012 Apr 9-12 59 37 5 2011 Apr 7-11 57 40 3 2010 Apr 8-11 59 36 5 2009 Apr 6-9 61 35 4 2008 Apr 6-9 60 35 5 2007 Apr 2-5 60 37 3 2006 Apr 10-13 60 34 5 2005 Apr 4-7 61 34 5 2004 Apr 5-8 62 33 5 2003 Apr 7-9 64 33 3 2002 Apr 5-7 58 37 5 2001 Apr 6-8 51 46 3 1999 Apr 6-7 45 49 6 1997 Mar 24-26 51 43 6 1946 Nov 15-20 60 34 6 1946 Feb 28-Mar 5 62 38 - 1945 Mar 10-15 85 15 - 1944 Mar 3-8 87 13 - 1944 Feb 90 10 - 1943 Feb 25-Mar 1 85 15 -
Taxes > Satisfaction Amount Americans Pay January Very satisfied Somewhat satisfied Somewhat dissatisfied Very dissatisfied No opinion % % % % % 2026 3 19 33 42 3 2025 4 22 30 40 3 2024 5 22 29 39 5 2023 5 21 28 43 3 2022 5 26 29 37 3 2021 6 30 30 31 4 2020 7 30 31 29 3 2019 7 33 31 25 4 2018 5 31 30 30 5 2017 6 33 28 30 4 2016 6 30 27 34 4 2015 7 25 32 31 5 2014 5 33 28 32 2 2013 6 30 27 33 4 2012 5 28 28 33 5 2008 5 29 32 30 4 2007 7 33 28 29 3 2006 6 32 30 31 2 2005 6 32 31 29 2 2004 4 30 34 30 2 2003 5 28 31 32 4 2002 6 32 32 28 2 2001 4 22 35 36 3
Groups Pay Fair Share Fair share Too much Too little No opinion % % % % <b>Lower-income people 2025 Mar 3-16 30 58 10 1 2024 Apr 1-22 30 50 14 5 2019 Apr 1-9 33 48 17 2 2018 Apr 2-11 32 49 16 2 2017 Apr 5-9 35 48 14 3 2016 Apr 6-10 31 46 20 3 2015 Apr 9-12 30 45 21 4 2014 Apr 3-6 33 41 23 3 2013 Apr 4-7 37 40 19 4 2012 Apr 9-12 33 40 24 3 2011 Apr 7-11 37 40 21 2 2010 Apr 8-11 35 39 22 4 2009 Apr 6-9 41 39 16 4 2008 Apr 6-9 32 51 13 4 2007 Apr 2-5 34 45 17 4 2006 Apr 10-13 36 46 12 6 2005 Apr 4-7 36 51 10 3 2004 Apr 5-8 35 49 12 4 2003 Apr 7-9 36 49 12 3 1999 Apr 6-7 34 51 11 4 1996 Apr 9-10 40 48 9 3 1994 Apr 16-18 43 42 12 3 1993 Mar 29-31 37 51 9 3 1992 Mar 26-29 32 57 8 3 <b>Middle-income people 2025 Mar 3-16 40 54 5 1 2024 Apr 1-22 41 51 3 5 2019 Apr 1-9 48 43 7 2 2018 Apr 2-11 51 42 6 1 2017 Apr 5-9 40 51 6 2 2016 Apr 6-10 39 53 6 2 2015 Apr 9-12 44 46 6 3 2014 Apr 3-6 42 49 7 2 2013 Apr 4-7 53 42 3 2 2012 Apr 9-12 56 36 6 2 2011 Apr 7-11 50 44 5 1 2010 Apr 8-11 49 43 6 2 2009 Apr 6-9 50 43 5 2 2008 Apr 6-9 50 43 4 3 2007 Apr 2-5 44 47 7 2 2006 Apr 10-13 50 43 5 3 2005 Apr 4-7 52 41 4 3 2004 Apr 5-8 47 46 4 3 2003 Apr 7-9 51 40 7 2 1999 Apr 6-7 35 59 4 2 1996 Apr 9-10 34 58 5 3 1994 Apr 16-18 39 57 3 1 1993 Mar 29-31 39 54 5 2 1992 Mar 26-29 36 57 5 2 <b>Upper-income people 2025 Mar 3-16 28 12 58 2 2024 Apr 1-22 27 12 55 5 2019 Apr 1-9 27 9 62 2 2018 Apr 2-11 26 10 62 2 2017 Apr 5-9 24 10 63 3 2016 Apr 6-10 21 15 61 3 2015 Apr 9-12 25 11 62 3 2014 Apr 3-6 24 13 61 2 2013 Apr 4-7 26 11 61 2 2012 Apr 9-12 25 10 62 3 2011 Apr 7-11 25 13 59 2 2010 Apr 8-11 26 15 55 4 2009 Apr 6-9 23 13 60 3 2008 Apr 6-9 24 9 63 4 2007 Apr 2-5 21 9 66 4 2006 Apr 10-13 21 8 67 4 2005 Apr 4-7 22 7 68 3 2004 Apr 5-8 24 9 63 4 2003 Apr 7-9 24 10 63 3 1999 Apr 6-7 19 10 66 5 1996 Apr 9-10 19 9 68 4 1994 Apr 16-18 20 10 68 2 1993 Mar 29-31 16 5 77 2 1992 Mar 26-29 16 4 77 3 <b>Corporations 2025 Mar 3-16 21 7 70 2 2024 Apr 1-22 17 7 70 6 2019 Apr 1-9 23 6 69 2 2018 Apr 2-11 24 7 66 3 2017 Apr 5-9 19 9 67 4 2016 Apr 6-10 16 12 67 5 2015 Apr 9-12 16 9 69 6 2014 Apr 3-6 20 8 66 5 2013 Apr 4-7 21 8 66 5 2012 Apr 9-12 21 11 64 4 2011 Apr 7-11 20 9 67 4 2010 Apr 8-11 22 9 62 7 2009 Apr 6-9 18 8 67 6 2008 Apr 6-9 15 6 73 6 2007 Apr 2-5 19 5 71 5 2006 Apr 10-13 18 5 70 7 2005 Apr 4-7 21 4 69 6 2004 Apr 5-8 19 5 69 7
Taxes > Least Fair Tax Table Federal income Federal Social Security State income State sales Local property No opinion % % % % % % 2023 Apr 3-25 34 10 14 12 29 2 2005 Apr 4-7 ^ 20 12 14 14 35 5
Taxes > Redistribute Heavy Taxes Rich Table Yes, should No, should not No opinion % % % 2022 Jul 5-26 52 47 1 2016 Apr 6-10 52 46 2 2015 Apr 9-12 52 45 2 2013 Apr 4-7 52 45 3 2011 Apr 7-11 47 49 4 2009 Mar 27-29 50 46 4 2008 Oct 23-26 46 50 4 2008 Apr 6-9 51 43 5 2007 Apr 2-5 49 47 4 1998 Apr 23-May 31 45 51 4 1939 Mar ^ 35 54 11
Taxes > Redistribute Heavy Taxes Rich Table Higher Lower No change No opinion % % % % 2021 Apr 1-21 57 8 33 1 2013 Apr 4-7 64 3 21 2 2012 Apr 9-12 53 3 41 3 2010 Apr 8-11 63 4 30 3 1994 Dec 16-18 35 20 41 4 1978 Jun 53 11 26 10 1978 Apr 60 7 25 8 1978 Feb 62 8 23 7 1977 Dec 67 8 18 7 1977 Nov 61 6 24 9 1977 Sep 61 5 27 7 1977 Jul 56 11 26 7 1977 Jun 59 10 23 8 1977 Apr 54 10 29 7 1977 Mar 48 14 29 9 1977 Feb 42 18 30 10 1977 Jan 40 19 32 9
Taxes > Approve Trump Tax Cut Law Table Approve Disapprove No opinion % % % 2019 Apr 1-9 40 49 11 2018 Sep 24-30 # 39 46 15 2018 Apr 2-11 # 39 52 8 2018 Feb 26-Mar 4 # 39 48 13 2018 Jan 2-7 # 33 55 12 2017 Dec 1-2 ^ 29 56 16
Taxes > Trump Tax Cuts Effect on Own Taxes Table Go up Go down Stay the same Unsure No answer % % % % % 2019 Apr 1-9 21 14 21 43 2 2018 Apr 2-11 9 18 17 55 1
Taxes > Have Tax Cuts Helped Family Financial Situation Table Helped a lot Helped a little Not helped No opinion % % % % 2018 Sep 24-30 12 26 51 10
Taxes > Seen Increase in Take-Home Pay Yes No No opinion % % % 2018 Sep 24-30 31 64 6 2018 Feb 26-Mar 4 ^ 32 64 4
Taxes > Tax Cuts Help Family Financial Situation Table Yes, would No, would not No opinion % % % <b>Trump tax cuts 2017 Dec 1-2 34 57 8 <b>Bush tax cuts 2003 Jun 27-29 ^ 34 56 10 2003 May 30-Jun 1 ^ 35 56 9
Taxes > Tax Cuts Help U.S. Economy Table Yes, would No, would not No opinion % % % <b>Trump tax cuts 2017 Dec 1-2 39 53 8 <b>Bush tax cuts 2003 May 30-Jun 1 ^ 47 47 6
Taxes > Effect on U.S. Deficit Table Increase deficit Reduce deficit No opinion % % % <b>Trump tax cuts 2017 Dec 1-2 52 38 10 <b>Bush tax cuts 2003 Jul 18-20 46 48 6
Taxes > Distribution of Money Fair Table Distribution is fair Should be more even No opinion % % % 2016 Apr 6-10 34 59 7 2015 Apr 9-12 31 63 6 2013 Apr 4-7 33 59 7 2011 Nov 28-Dec 1 35 61 4 2011 Apr 7-11 35 57 8 2009 Mar 27-29 35 59 6 2008 Oct 23-26 37 58 5 2008 Apr 6-9 27 68 5 2007 Apr 2-5 29 66 5 2003 Jan 10-12 31 63 6 2000 Sep 11-13 38 56 6 1998 Apr 23-May 31 31 63 6 1996 Apr 25-28 33 62 5 1990 May 17-20 28 66 6 1984 Dec 7-10 31 60 9
Taxes > Distribution of Money Fair Table More services, More taxes Less services, Reduce taxes Services and taxes as now No opinion % % % % 2013 Sep 5-8 Л† 20 47 29 4 2011 Sep 8-11 16 56 26 3 1993 Mar 22-24 20 40 35 4
Taxes > Services Versus Taxes Table Favor Oppose No opinion % % % 2012 Apr 9-12 60 37 3
Taxes > Best Approach Economy Table Reducing deficit Increasing taxes on wealthy Cutting taxes Increasing stimulus spending No opinion % % % % % 2010 Nov 19-21 39 31 23 5 2
Taxes > Bush Tax Cuts Expire Table Keep for all taxpayers Keep for those making less than $250,000 Allow to expire for all taxpayers No opinion % % % % 2010 Aug 27-30 37 44 15 4
Taxes > Do With Tax Rebate Table Pay off bills Save or invest Spend Donate No opinion % % % % % 2008 Apr 6-9 41 29 24 1 4
Taxes > Why Prefer Taxes Table Get a refund Break even Does not apply (vol.) No opinion % % % % 2007 Mar 2-4 45 50 3 2
Taxes > Why Prefer Tax Refund Table 2007 Mar 2-4 % It's like getting a bonus/reward/nice to get extra money 39 Forced savings/not good at saving otherwise 17 To be safe/conservative/don't want to have to owe 11 Believe taxes are too high 11 Helps with paying the bills 5 Use to pay state/local taxes 4 Use it to buy something wouldn't otherwise/Use for special purchase 3 Use it on a vacation 1
Taxes > How Most Likely Use Tax Refund Table 2007 Mar 2-4 % Put it in a savings account or invest it 24 Use it to pay a major bill 38 Spend it on a vacation 5 Spend it on some other major purchase 7 Not do anything special with it 20 Doesn't apply/don't file (vol.) 4 No opinion 2
Taxes > Easier Harder to Cheat on Taxes Table Easier No change Harder No opinion % % % % 2005 Apr 4-7 21 35 30 14
Taxes > File Electronically Mail Table Mail Electronically Unsure (vol.) Not filing (vol.) No opinion % % % % % 2005 Apr 4-7 43 44 10 2 1 2003 Apr 7-9 52 34 3 11 * 2001 Apr 6-8 62 28 2 7 1 1999 Apr 6-7 66 20 4 9 1 1997 Mar 24-26 77 15 2 6 *
Taxes > Favor Bush Tax Cuts Permanent Table Favor Oppose No opinion % % % 2004 Dec 17-19 ^ 52 40 8 2002 Nov 8-10 64 29 7
Taxes > Changes Tax System Table Completely overhauled Major changes Minor changes Fine as is No opinion % % % % % 2004 Dec 17-19 ^ 24 35 29 11 1 2000 Jan 13-16 26 35 28 9 2
Recommended
Democrats are less likely than in the past to see conditions as positive, while Republicans are upbeat, as is typical for them with a GOP president.
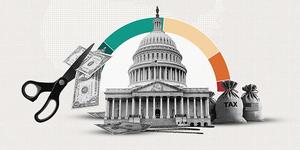
Americans favor spending cuts over tax hikes to reduce the deficit, although a majority of U.S. adults support taxing the wealthy to raise revenue.
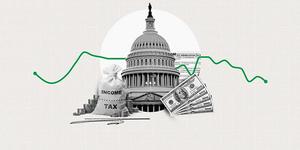
The 46% of U.S. adults who say their income taxes are fair essentially matches the record-low 45% from 1999.
Americans expect a difficult 2026, expressing pessimism about most economic, political and global matters — with the stock market a notable exception.
УЕГЫґ«ГЅ /poll/1714/Taxes.aspx УЕГЫґ«ГЅWorld Headquarters, 901 F Street, Washington, D.C., 20001, U.S.A